Manufacturing in China Blog
Here you can leave comments and start discussions about manufacturing parts of complete products in China.
THERMOELECTRIC HEAT SINK, MODELING AND OPTIMIZATION
- Hits: 4915
- 0 Comments
- Subscribe to updates
- Bookmark
THERMOELECTRIC HEAT SINK, MODELING AND OPTIMIZATION
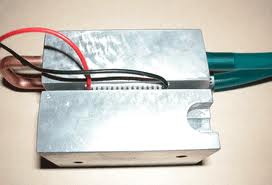 Proper design and optimization of a thermoelectric (TE) heat sink has been a topic of some neglect in the design of the TE cooling systems. Collectively, TE material researchers have spent tens of millions of dollars to advance the performance level of TE materials only to have it dashed away by ineffective heat sink design. The combination of detailed thermal modeling and high-speed personal computers makes it no less effort to fully optimize a heat sink design then to just derive one that "works." Of course, derivation of a thermal model employing accurate calculations for fluid dynamics and heat transfer can be a significant investment of time and effort but, once completed, the pay-off can yield big dividends. The process of model development begins with examination of classical fluid dynamic theory but should be validated and verified by experiment. The model used by TE Technology, Inc. was developed over a period of over 30 years using feed-back test data from literally thousands of exchangers and exchanger configurations. Empirical corrections were applied to adjust the classical theory to better match "realworld" test results. As such, the details of this model are proprietary. However, the use and application of this model and the methods employed to optimize are the subject of this paper.
SYSTEM DESCRIPTION
Throughout this paper, the term, heat sink, shall refer to a metal (usually aluminum) exchanger with a fluid flowing through it. Aircooled heat sinks can consist of a finned area with either flat, louvered, wavy, perforated, "breathing effect," slotted or pin-type fins. These exchangers are usually combined with a centrifugal blower or tubeaxial-type fan as the air mover. The air direction can be vertical, parallel or radial. Although the method demonstration presented in this paper involves a simple flat fin exchanger together with a tubeaxial fan and centrifugal blower, the principles and methodology are generically the same as with other configurations, including liquid-cooled heat sinks. Of course, liquid cooled heat sinks can involve simpler tube-type configurations because of the higher heat transfer characteristics of water or other liquids. Properly applied, the methods described in this paper provide the means for optimizing the heat sink design and cold or hot extenders as described by Lau., et al (1). The result can maximize the effectiveness of the TE modules resulting in reducing size, weight, power-consumption and cost of the entire thermoelectric product, as described by Ritzer.
AIR MOVER (Coolong Fan) CHARACTERISTICS
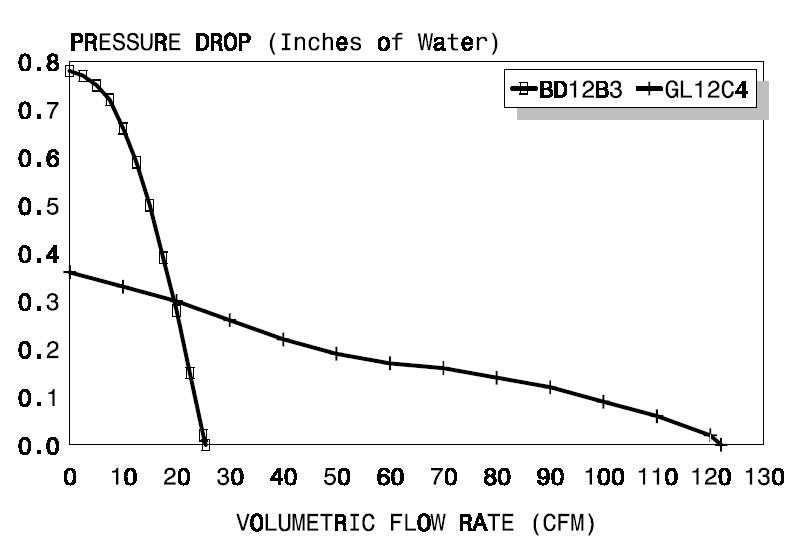
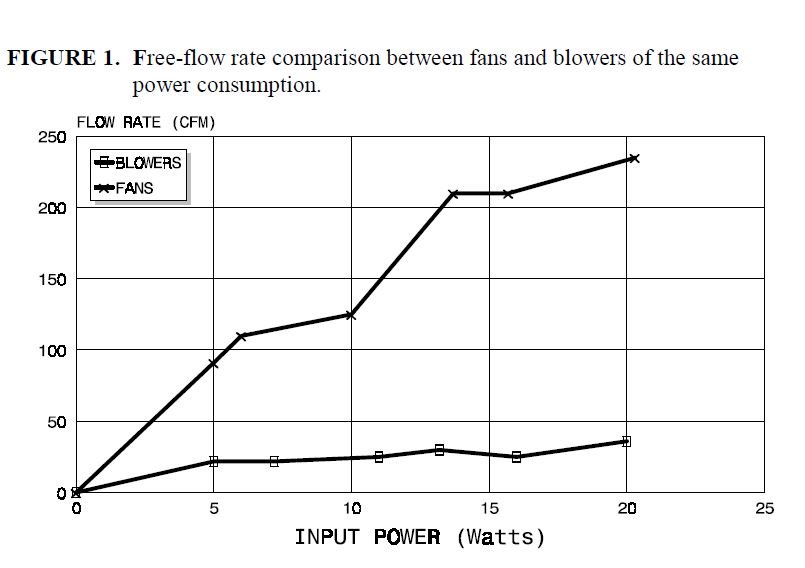 After the general size of the heat exchanger has been scoped, selection of the potential air movers should be the first step in the design optimization process. This is because geometry and configuration of the air mover is fixed, once selected. Whereas, the mating finned exchanger is flexible and can be modified to accommodate the air mover characteristics. FIGURE 1. Free-flow rate comparison between fans and blowers of the same power consumption. FIGURE 2. Stall pressure head comparison between fans and blowers of the same power consumption.Figures 1 and 2 illustrate the typical maximum characteristics of tubeaxial fans versus centrifugal blowers as a function of the power required to drive them. Each point on the charts are different models of fans and blowers. These are specific data taken from a single manufacturers, but they represent the typical trends of all fans and blowers. That is, fans typically increase quite rapidly
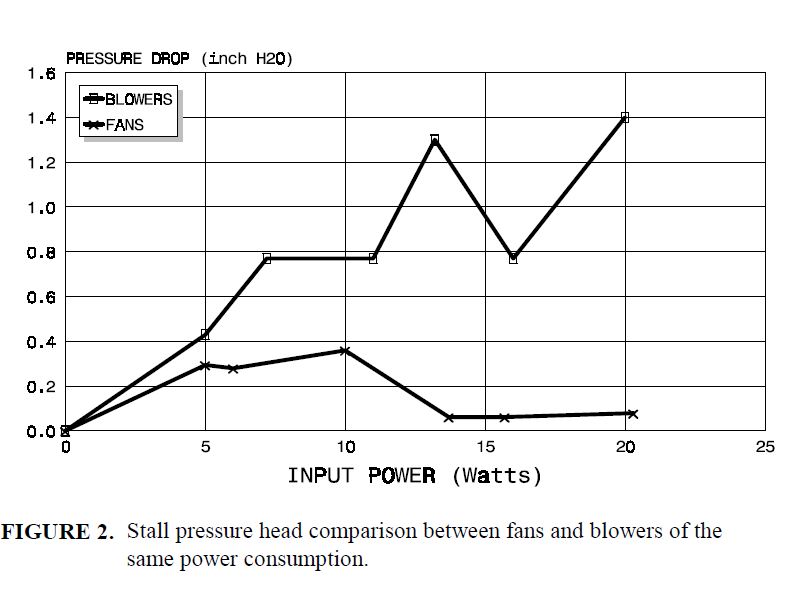 with free flow rate but blowers do not improve much in this respect as input power increases. The reverse of this situation is evident in Figure 2 with respect to maximum pressure head. Blowers are typically high pressure air movers and increase rapidly in this feature as the size (input power) increases. It is interesting to note that higher power fans actually deliver less pressure head even though their free flow rate has greatly increased. One might surmise from these graphs that the best way to capitalize on the combinations of these properties is to use a fan for low density (more open area) exchangers, where high flow rates can be achieved. Conversely, one might also expect that a high density and interruptive fin-type exchanger may be better for a blower which can more easily overcome the higher pressure head generated. Indeed, this trend is typical, but it can also be surprising how similar the optimum exchanger can be for both kinds of air movers. The complete characteristics for the selected 10 Watt and 20 Watt fans and blowers are given in Figures 3 and 4. These curves are quite typical for an
 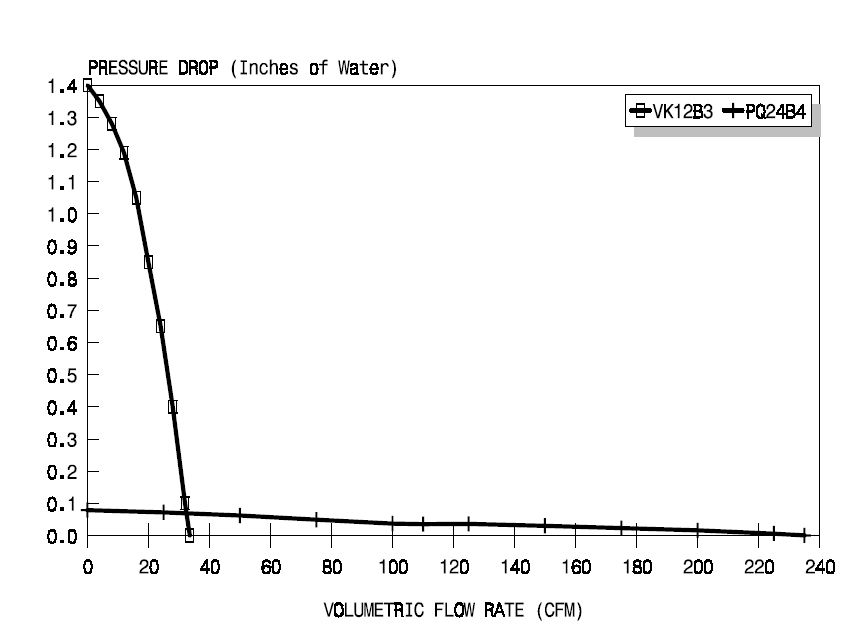 equal-sized fan versus blower and appear to suggest quite different optimum heat exchanger designs. FIGURE 3. Performance characteristics of a 10 watt fan versus a 10 watt blower. FIGURE 4. Performance characteristics of a 20 watt fan versus a 20 watt blower.
EXCHANGER CHARACTERISTICS
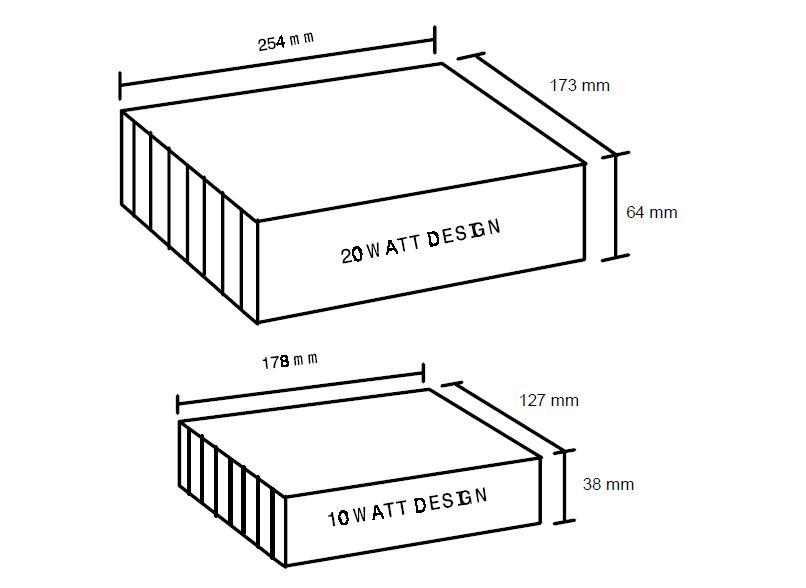
The detailed configurations and maximum enveloped dimensions for the selected exchangers are given in Figure 5. FIGURE 5. Exchanger configurations selected to study the optimization process for each selected air mover. These two example systems were arbitrarily chosen in order to illustrate the nature of the modeling calculations and the heat sink design optimization process. The 10 Watt heat sink system is typical for small, portable TE refrigerators using one or two 12-volt TE modules. The 20 Watt heat sink system is typical for many laboratory or instrument cooling units where two to four TE modules are used. The air flow enters the ends of each exchanger through the open end indicating by the vertical fins and travels parallel with the fins exiting the opposite end. The performance of these two exchangers, using fin geometry consistent with standard finned extrusions, is illustrated in Figures 6 and 7. FIGURE 6. Fluid dynamic performance characteristics for the selected exchangers. 173 mm 64 mm 127 mm 38 mmThe 20 Watt extrusion, having more open area, exhibits a lower pressure drop for any given flow rate (Figure 6) and a lower (better) heat sink resistance (HSR) for any given flow rate by virtue of its larger overall finned surface area. FIGURE 7. Thermal performance characteristics for the selected exchangers
The optimization of the air mover-plus-exchanger consists of changing the fin density (number of fins over the indicated area) and thickness of the fins. This is evident 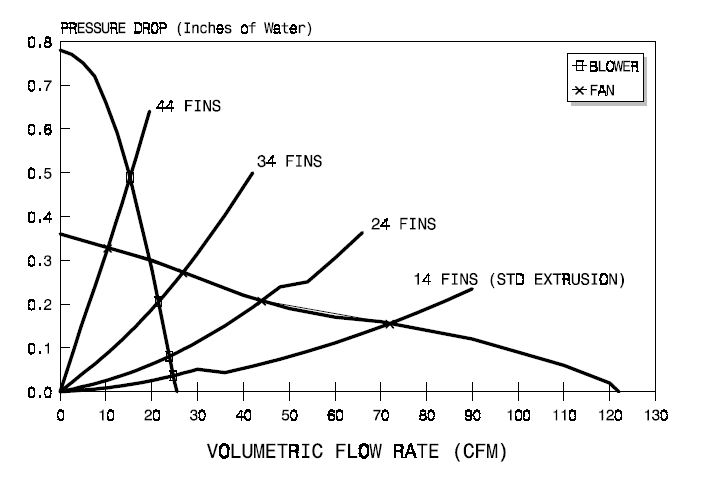
from Figures 8 and 9 for the 10 Watt case. FIGURE 8. Effect of fin density on fluid dynamic characteristics for the 10 watt system. FIGURE 9. Effect of fin density on thermal performance of the 10 watt system. The fin thickness was held constatnt while the number of fins was parametrically increased from 14 (typical for a standard extrusion withdimensions as given in Figure 5 for the 10 Watt exchanger) to 24, 34 and, finally to 44 fins. As one would expect, the pressure head needed to establish a given flow rate increased, primarily due to less and less open area. The performance curves for the fan and blower are also plotted in Figure 8 together with the exchanger curves. The points of intersection represent the operating points of the respective fan-plusexchanger system. For example, if the 14-fin exchanger were to be combined with the fan, the air flow would be approximately 72 CFM. Similarly, if combined with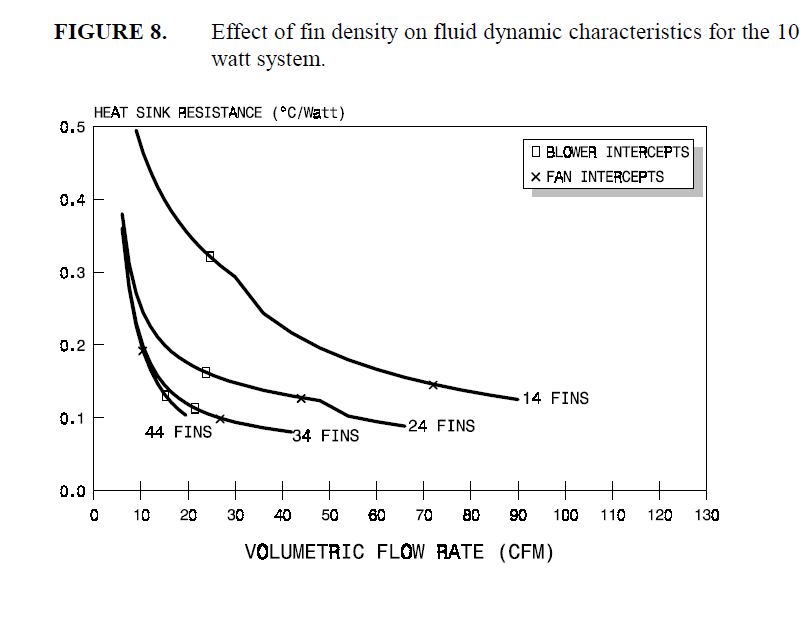
the blower, it would only be 25 CFM. Clearly, the resulting HSR is much better for the fan system as indicated in Figure
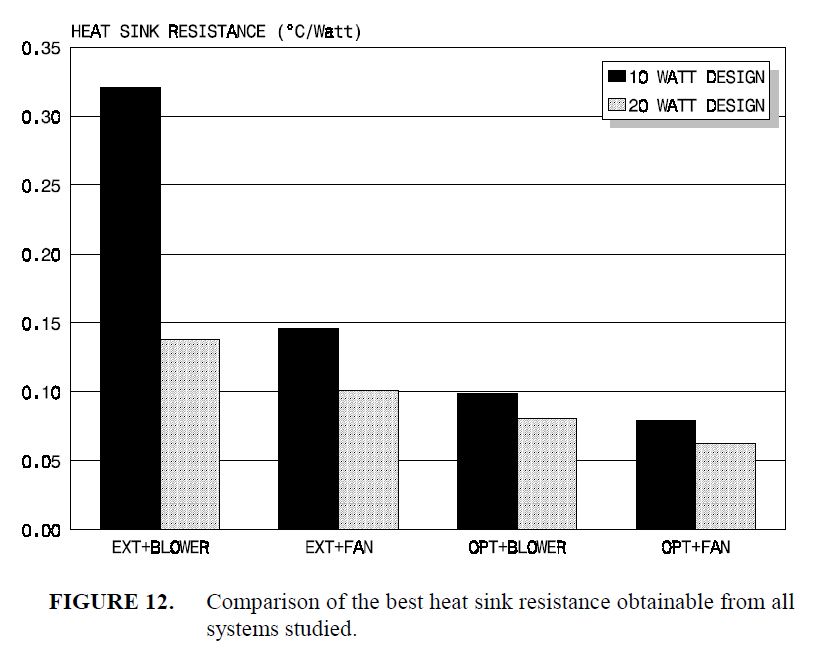
8. The operating point for the blower yielded an HSR of approximately 0.32oC/Watt while the fan produced a much better HSR value of approximately 0.15oC/Watt. The intercepts for each exchanger design indicates improvement in HSR as the number of fins increase but eventually passes through a minimum and rises as the optimum fin density is surpassed. The finer detail of this optimization process is illustrated in Figure 10. FIGURE 10. Heat sink optimization calculations parametrically with fin thickness for 10 watt system using a fan. These set of curves are for the 10 Wattdesign combined with a fan. The case illustrated in Figures 8 & 9 for the fan correspond to the 1.63 mm thickness fins. Here, it is observed that the best HSR is achieved when the number of fins is approximately 34 as 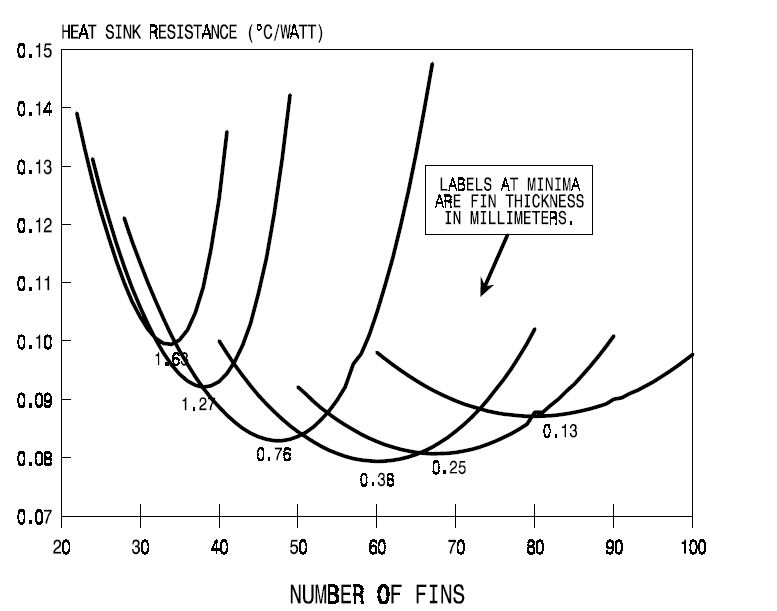 verified in Figure 9. The next step in the optimization process was to change the fin thickness and repeat the entire set of calculations. Figure 10 represents six separate steps in fin thickness and the determination of minimum HSR for each fin thickness. Note that the optimum fin density shifts for each selected fin thickness. Also, there will exist a single case of fin thickness and fin density that represents an optimum of the optima. This is further illustrated in Figure 11.These curves were constructed by connecting the minimum HSR points for each parametric value of fin thickness. In fact, the case marked "10 WATT FAN" corresponds to the data given in Figure 10. FIGURE 11. Summary of heat sink optimization calculations for 10 watt and 20 watt systems. The other curves represent the results for the other three cases studied. These four "OPTIMUM" designs are depicted in the summary bar
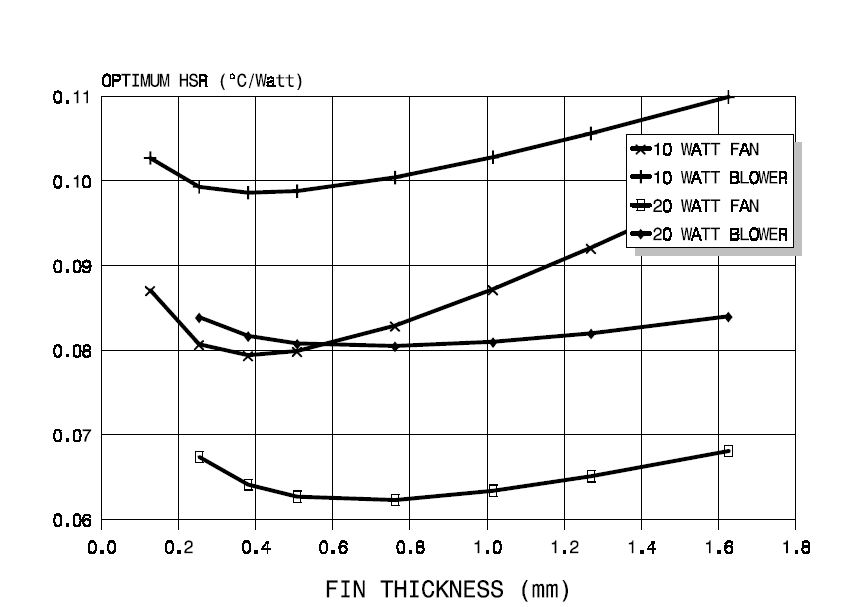 chart given in Figure 12 together with the original cases representing standard-extrusion-type fin geometry. FIGURE 12. Comparison of the best heat sink resistance obtainable from all systems studied.
CONCLUSIONS
The results given in Figure 12 indicate the impact of exchanger optimization on the overall HSR of the system. It also suggests some interesting trends:
1. A blower in combination with a standard extrusion appears to be an especially poor combination. This is quite interesting in view of the fact that many commercial TE products now being marketed employ that combination.
2. The optimization process appears to be well worth the effort wherever overall performance is important. In fact, it has been shown by Ritzer, et al (2) that the optimization process can also yield the lowest cost design, holding HSR constant.
3. According to the results given in Figure 11, it is interesting to note that the geometry of the optimum exchanger design is not so different for a fan versus blower of the same power input. This quite unexpected since the performance curves are quite different as shown in Figures 3 and 4. This is especially surprising for the 20 Watt case where these curves are so dramatically different.
4. At least for the cases studied, the use of a fan appears to be the best choice when input power is driving the selection. Furthermore, the heat exchanger design is much more "forgiving" when a fan is used.
Finally, the impact of an improved HSR is illustrated in Figure 13. This curve was extracted from the analysis presented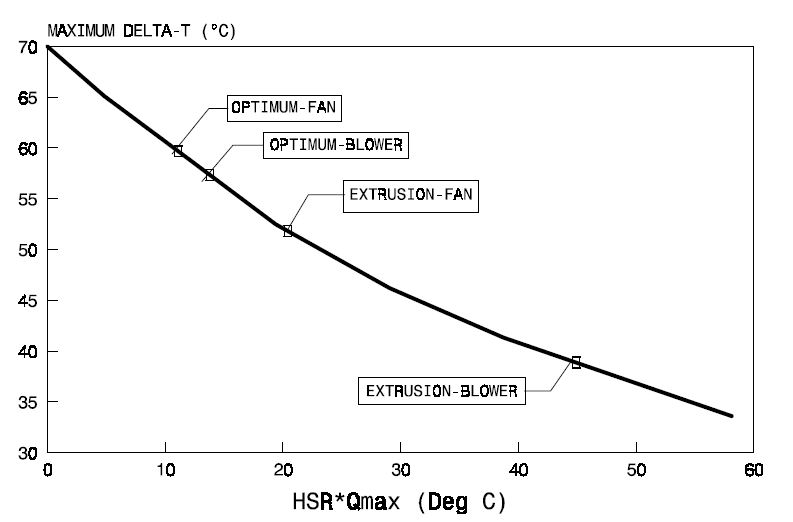 by Nagy, et all (3). One can observe that over 30oC can be lost from ideal maximum cooling performance using a simple standard extrusion with a 10 Watt blower. Optimization and the use of a 10 Watt fan can recover up to 20oC of that loss. This corresponds to a TE material improvement in Z of more than 0.9 x 10⁻³oK-1. From 1960 to 1994 the thermoelectric cooling industry gained less than onethird that amount! Certainly, the effort put into heat sink optimization is well worth while when viewed on these terms. FIGURE 13. Effect of heat sink resistance on the maximum cooling performance of an example system consisting of two TE modules on the selected 10 watt system.
REFERENCES
1. Lau, P.G., Ritzer, T. M, and Buist, R. J., "Optimization of Hot/Cold Sink Extenders in Thermoelectric Cooling Assemblies" in Proceeding of the XIII International Conference on Thermoelectrics, Kansas City, Missouri, USA, 1994.
2. Ritzer, T. M, Nagy, M. J. and Lau, P.G., "Economic Optimization of Heat Sink Design" in Proceeding of the XIII International Conference on Thermoelectrics, Kansas City, Missouri, USA, 1994.
Comments
